EAGE digital 2025

Short Course 1

EAGE digital 2025

Short Course 1

Short Course 1

Date Thursday, 27 March

Time 09:00 – 16:30

Data Visualization Principles for Scientists

Dr. Steve Horne Silixa Ltd UK

Instructor Name Company/Title

Description

If you care about science communication you must care about data visualization. Effective data visualizations provide new and rapid insights that text and speech will struggle to convey. And yet few people are taught how to plot data during their scientific careers. For many of us the education stopped at ‘make sure you label your axes’. But there is so much more to learn if we want to spread our messages clearly and efficiently to a new audience.

This course is all about understanding what makes a great data visualization great and how bad visualizations can deceiver – sometimes intentionally.

The course will include quick reviews on pivotal visualizations and on the human vision system. This naturally leads to a session on choosing colour schemes to avoid excluding a significant proportion of our audience with colour vision deficiencies. We will learn why the rainbow colour scheme is generally a poor choice for scientific data visualizations and how to choose a better colour palette.

We will learn how the human brain is wired to quickly interpret some visual arrangements. We can exploit this by designing our plots in accordance with a few key principles. Fonts, or more strictly speaking, typefaces, are another design option that few people are given guidance on. But the choice of font can have a subliminal bias in the way that people absorb information. Choose the wrong font and our plots will be interpreted as amateurish.

At the end of this course you will understand how to make an effective scientific data visualization.

Course Objectives

Upon completion of the course, participants will be able to:

  1. Choose appropriate chart types
  2. Apply good design principles
  3. Avoid common mistakes
  4. Identify misleading and poorly designed visualizations
  5. Produce clear and elegant visualizations

Short Course Schedule

The course will begin with a motivation on why data visualization matters. The instructor will show good, bad and ugly visualizations and dissect these to understand what makes a good data visualization and how some plots deceive – sometimes intentionally!

Next, the instructor will take a fast historical tour taking in pivotal plots from, among others, Florence Nightingale, William Playfair, John W. Tukey and Edward Tufte.  There will be a deep dive into human colour perception to discuss issues around colour vision deficiencies and how we can reach a wider audience by a careful choice of colours.

On the theme of human visual perception Dr. Steve Horne will review pre-attentive attributes and the Gesthalt principles and how these can be employed in charts. Horne will pay particular attention to line charts, pie chart and why 3D effects should only be used with caution.

The last taught session will review typefaces (fonts), tables and file formats before moving to a practical session where participants will be asked to choose a plot, identify any short comings and then redesign it based on the principles we have learnt during the day.

Course topics include

1) Why data visualization matters
2) Short History
3) Human Vision
4) Colour Palettes
5) Preattentive attributes & Gesthalt principles
6) Line charts, Pie & Donut Charts, 3D effects
7) Typefaces,
8) Tables & Layouts
9) File formats (JPEG, PNG, SVG etc)
10) Visualization makeover

Participant Profile

This course is for anyone who is interested in getting familiar with running machine learning applications and data analytics for subsurface data. Domain knowledge of subsurface data, such as petrophysics, facies, seismic, production/PTA would be beneficial.

Prerequisites

  • Participants should be reasonably confident with a data visualization tool e.g. Excel, Matlab, Python etc. as we will be performing a data visualization makeover in our last session of the day.
  • The participants are required to bring their personal laptops equipped with data visualization software such as Excel, Matlab or Python.

Recommended reading:

1. Tufte, E. 1983. The Visual Display of Quantitative Information. Graphics Press USA.

2. Cairo, A. 2016. The Truthful Art: Data, Charts, and Maps for Communication. New Riders.

Short Course Programme

00:00 - 00:00Lorem ipsum dolor sit amet, consectetur adipiscing elit. Curabitur non hendrerit turpis, ac mollis quam.

See all activities

Seize the chance to elevate your skills in digitalization! By registering for one of our workshops, short courses, or field trips, you’ll gain cutting-edge insights, hands-on experience, and connect with industry experts. These activities are crafted to keep you ahead in a rapidly digitalizing world. Don’t wait—take the first step towards mastering the digital transformation!

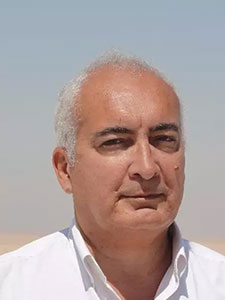
Dr-Dominique-Guerillot

Dominique Guérillot

President & CEO TERRA 3E

Prof. Dr Dominique Guérillot, former member of the Executive Committee of IFP and Program Director for the Upstream R&D of Saudi Aramco, he is focusing in Oil and Gas Exploration and Production including Unconventional, CO2 EOR and Carbon storage. After a PhD in Applied Mathematics, he joined IFP in 1982 in the Reservoir Engineering Dpt.

He started his career in the Exploration and Production sector developing Expert system for selecting EOR methods and Advanced Compositional Reservoir Simulators for EOR (CO2 and thermal methods).

In 1985, he began cooperating with geologists and he invented with the Paris School of Mines the first software package integrating reservoir characterization and flow simulations in porous media proposing innovative methods for upscaling absolute permeabilities.

After being the Director of the Geology and Geochemistry (95-01, in 2001, he became member of the Executive Committee of IFP and Managing Director of Exploration and Reservoir Engineering Centre with a total budget of 30 Millions of Euros. Consequently, IFP nominated him as board member of several Exploration and Production subsidiaries of IFP: Beicip-Franlab and RSI in France, IFP MEC in Bahrain, etc. He developed new strategic orientations for the business unit he was in charge modifying its business model to generate revenues based on royalties through the development of several strategic marketed software for IFP.

In 2009, he created a Young Innovative Company (YIC), Terra 3E, in Energy and Environment: http://www.Terra3E.com developing innovative plug-ins in Petrel software among which the first tool for accurate calculations of fluids in place for gas and oil shales and upscaling transmissivities. From 2010 to 2013, he was senior expert for Petrobras, Brazil.

In 2012, he served the European Commission for selecting R&D projects on CO2 Storage. In 2013, Qatar Petroleum called Dominique Guérillot for developing their R&D Centre at the Qatar Sciences and Technology park in Doha, Qatar. He is currently full professor at Texas A&M University in their campus of Qatar.

He published more than 50 full and refereed papers, holds 5 patents, is member of the IJOGCT editorial team, the SPE and EAGE associations, is referee of the Oil & Gas Science and Technology (OGST), and member of the editorial board of the Petroleum Geoscience journal of the Geological Society.

Message will be send to corporate relations

Message will be send to the exhibition department

Message will be send to the registration department

Message will be send to the europe department

Message will be send to the abstracts department